



Troya 360
An agency sees every client account in one place, and what to do about each one.
The problem
A marketing agency ran a dozen client accounts out of platform exports. Every month meant downloading Meta reports and spreadsheets, rebuilding the same comparisons by hand, and still not being able to say which accounts were slipping or what to do about them this week.
What we built
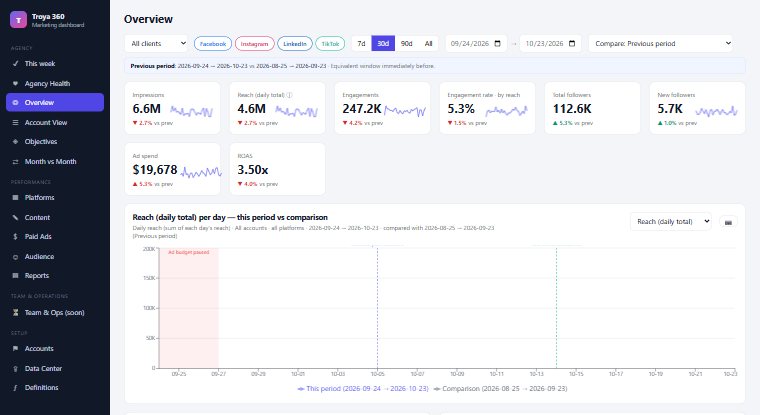
A performance dashboard for the whole portfolio. Exports go in once, are validated centrally, and are reused everywhere: agency health, per-account detail, month-over-month, content and paid analysis, and client-ready reports.
Key workflows
- Drop in Meta exports or any Excel and CSV, recognised by column name in English or Arabic
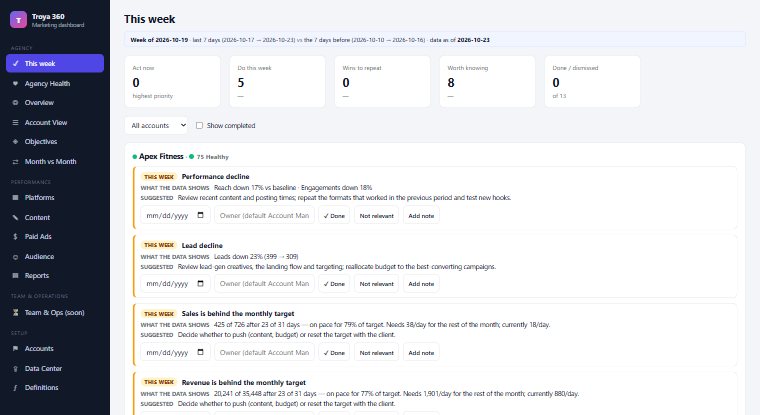
- A weekly ranked action list per account, each with the numbers behind it and a suggested next step
- Pacing against monthly targets, so you know mid-month whether you will land them
- Client reports exported as PDF, PowerPoint, Excel, CSV or PNG
Result
The dashboard refuses to flatter the data. A metric a platform never supplied is named as missing rather than drawn as zero, posts without a reach value are left out of rankings instead of counted as nothing, and a logged event next to a spike is offered as possible context, never as proven cause.